Tuesday, May 1, 201
By Scott Pluschau
http://scottpluschau.blogspot.com
Last weekend's review in the Nasdaq 100 covered the COT report and can be found here: http://scottpluschau.blogspot.com/2012/04/weekend-update-nasdaq-100_29.html
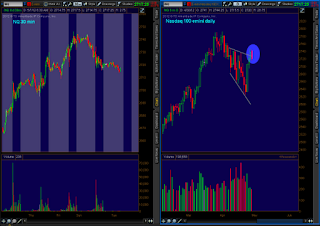
(The April 30th) daily candlestick is known in Japanese Candlestick analysis as a Bearish "Dark Cloud Cover". See right hand side chart below. A dark cloud cover is a potential reversal pattern when a market gaps up at the open and closes below the halfway point of the previous candle. This price action makes the bulls think twice about their prospects for a continuing trend. Keep in mind I believe Japanese Candlestick analysis is useless without confirmation. I point it out because I want to be early in recognizing a potential change in trend. Being early in recognition prepares a game plan. Reacting early ruins one.
What makes this more interesting than normal is the fact that it took place at the highs of this rally and closed beneath a prior major multipoint resistance trendline. Volume was weak than the prior day which was weak enough as it was. Nonetheless this is a classic setup.
(Click on chart to expand)
twitter/ScottPluschau
Consulting? ScottPluschau@gmail.com
Members to Scott's blog are appreciated
Comments are welcome

No comments:
Post a Comment